Note
Go to the end to download the full example code.
Learn NANI in 60 seconds!
How to use NANI in 60 seconds? Say no more!
The main idea is to use the NANI to optimize initial centroids so k-means is 100% deterministic, converges faster, and finds better solutions. Here is a simple example to get started.
The pwd of this script is $PATH/MDANCE/examples.
Let’s start with importing necessary libraries.
from matplotlib import pyplot as plt
from sklearn.cluster import KMeans
from sklearn.datasets import make_blobs

from mdance.cluster.nani import KmeansNANI
- Data
Load the data from a file, must be array of shape (n_samples, n_features).
In this example, we will generate synthetic data using
make_blobsfrom Fig. 2 of the NANI paper.
n_clusters = 7
data, true_labels = make_blobs(n_samples=1000, centers=n_clusters, n_features=2, random_state=0)
First, let’s checkout how state-of-the-art k-means performs on the data. which uses k-means++ initialization.
og_kmeans = KMeans(n_clusters=n_clusters, init='k-means++', n_init=1, random_state=42)
og_kmeans.fit(data)
og_kmeans_labels = og_kmeans.labels_
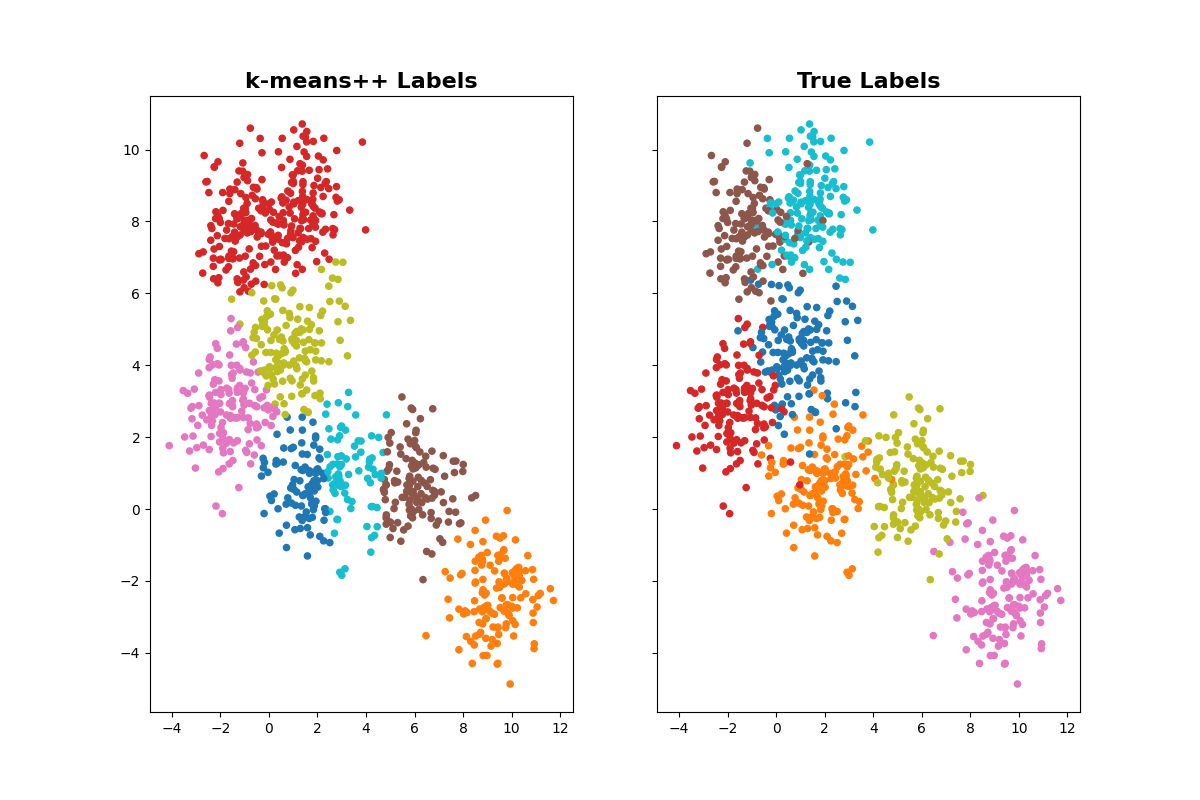
Visualize the clustered results to true labels.
fig1, ax1 = plt.subplots(1, 2, figsize=(12, 8), sharex=True, sharey=True)
ax1[0].scatter(data[:, 0], data[:, 1], c=og_kmeans_labels, cmap='tab10', s=20)
ax1[0].set_title('k-means++ Labels', fontsize=16, fontweight='bold')
ax1[1].scatter(data[:, 0], data[:, 1], c=true_labels, cmap='tab10', s=20)
ax1[1].set_title('True Labels', fontsize=16, fontweight='bold')
plt.show()
NANI
As you can see, k-means++ initialization did not get it right. Let’s use NANI to optimize initial centroids.
Create an instance of KmeansNANI.
data: data to cluster.
n_clusters: number of clusters.
mod = KmeansNANI(data=data, n_clusters=n_clusters, metric='MSD', N_atoms=1,
                 init_type='strat_all', percentage=10)
initiators = mod.initiate_kmeans()
initiators = initiators[:n_clusters]
- k-means with NANI
Create an instance of KMeans.
n_clusters: number of clusters.init: initial centroids.
n_init: NANI only needs one initialization!random_state: We don’t need this because NANI is 100% deterministic!
kmeans = KMeans(n_clusters=n_clusters, init=initiators, n_init=1, random_state=None)
kmeans.fit(data)
kmeans_labels = kmeans.labels_
- Plot
Visualize the clustered results to true labels.
fig, ax2 = plt.subplots(1, 2, figsize=(12, 8), sharex=True, sharey=True)
ax2[0].scatter(data[:, 0], data[:, 1], c=kmeans_labels, cmap='tab10', s=20)
ax2[0].set_title('NANI Labels', fontsize=16, fontweight='bold')
ax2[1].scatter(data[:, 0], data[:, 1], c=true_labels, cmap='tab10', s=20)
ax2[1].set_title('True Labels', fontsize=16, fontweight='bold')
plt.show()

As you can see, NANI clustered the data perfectly!
- That’s it! You have successfully used NANI to optimize initial centroids for k-means clustering.
kmeans_labels: cluster labels assigned by k-means using NANI.
For more advance usage, please look at the NANI Tutorial. Why? Because NANI can also predict number of clusters, work with Molecular Dynamics data, and more!
Total running time of the script: (0 minutes 9.542 seconds)